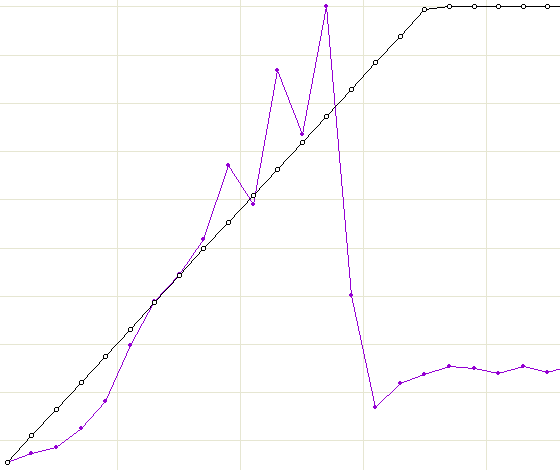
 When you load test a web application and gradually increase the number of virtual users during the test, you usually expect to see gradually degrading performance parameters such as response time. The number of pages (sessions or hits) per second will reach maximum in some moment and will probably stay the same for the rest of the test despite the growing load. This is simply because the site cannot serve more requests per second, so it has to postpone the new coming ones.
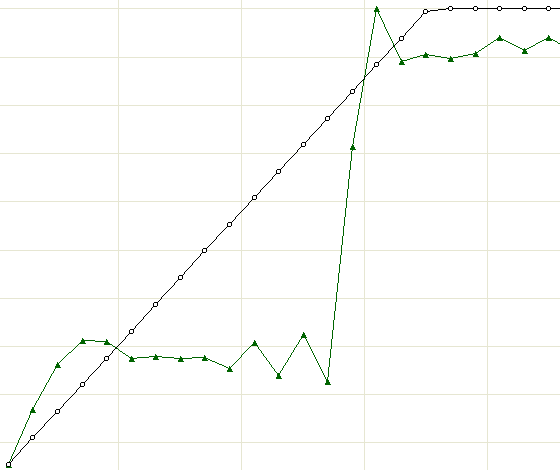
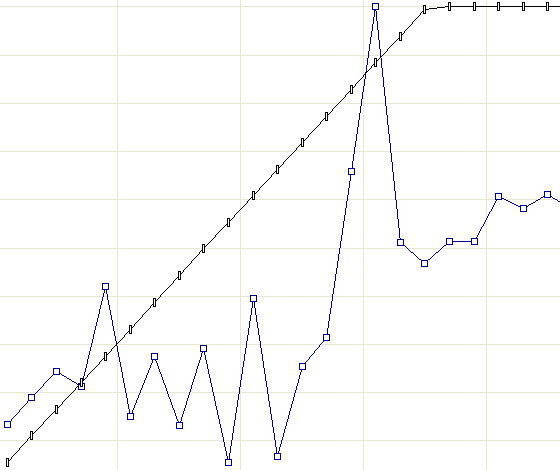
In reality you will probably see something like that, but only for a limited time. When the load goes even higher, you can get another picture that may seem surprising at first glance. It is illustrated by the following three charts. Black line in all charts represents the number of virtual users.


As you can see, at some point in time the response time drops while the number of pages per second goes up. Looks like the site started to perform much better. However this is a misleading impression. The error rate chart explains the situation. It shows that the number of errors picked exactly at the same moment.
Now we can interpret what we see. When the load on the server started to grow, it produced longer and longer delays. The response time got higher. At some moment the server had to drop the waiting connections, which resulted in the avalanche of errors and reconnect attempts.
Note that different requests can produce significantly different load on the site. A request to a static page only produces some load on the web server. It does not require any work from other system components. So, after virtual users massively restarted their sessions, the site switched from serving “heavy” requests to “light” requests. As a result, the averaged performance parameters improved. Of course this does not mean any change in the actual performance.
Conclusion: when analyzing response time and throughput numbers you should always take into account the error rate and session logs. You can directly compare performance numbers for different test periods only if the activity of virtual users is similar for those periods.

Very nice and meaningful comments by Ivan. I have gone through various site to check the impact analysis of WAPT tool but couldn’t find any interesting point there.
Thanks for the post