Server Monitoring Software Stop losing clients due to late detection of web server glitches. Monitor availability and performance of your servers and network resources.
Response Time
Response Time
Response Time report represents the values of
server response time.
Average and maximum response times are the most important characteristics of load testing.
They tell you how long a user waits for server response to his request.
You should ensure that users of your site/application get the response in acceptable time.
There are 3 important limits for response time values: 0.1 second.
It is an ideal response time. Users feel that the system is reacting instantaneously, and do not
sense any interruption. 1.0 second.
It is the highest acceptable response time. Users still do not feel an interruption, though they
will notice the delay. Response times above 1 second interrupt user experience. 10 seconds.
It is the limit after which response time becomes unacceptable. Moreover, recent studies show
that if response time exceeds 8 seconds, user experience is interrupted very much and most
users will leave the site or system.
Normally, response times should be as fast as possible. The interval of most comfortable
response times is 0.1 - 1 second. Although people can adapt to slower response times, they are
generally dissatisfied with the times longer than 2 seconds.
Click on the Response Time subfolder of Summary Report folder in the Navigation Pane to view
the Response Time report.
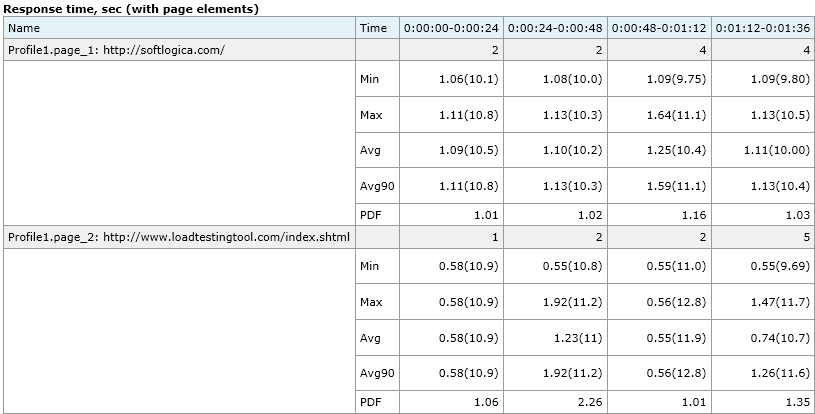
You can see values of response time for each request, as well as
minimum (Min), average (Avg),
Avg90 and maximum (Max) values of response time.
Next to the name of each request you can see how many times it was processed at the specified periods of time.
If some column in the table is empty, it means that request was not
executed during a period specified in column header.
Decrease the Number of columns in tables value in
Log and Report Settings. Then time intervals in column headers
will be increased. Run the test again to verify that you get correct results.
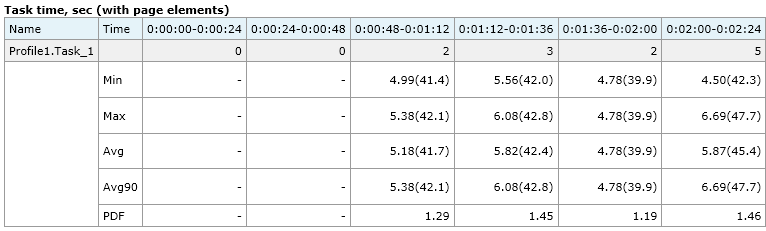
Task time
This table shows the time of processing various tasks that you added to user profiles.
A task is a sequence of requests inside the Task
operator. The program calculates the total time of processing such sequences of requests.
Note that task time does not include delays between pages. It is the "pure" time of requests processing.
In the table you can see the minimum (Min), average (Avg),
Avg90 and maximum (Max) values of task time.
Next to the name of each task you can see how many times it was processed. In other words,
you can see the number of completed tasks. A task is considered completed if all its
elements were completed and there were no errors. If there were errors during the task processing,
that pass of the task is not included in statistics.


 Stop losing clients due to late detection of web server glitches. Monitor availability and performance of your servers and network resources.